Crises occur. Sometimes they are predictable due to a buildup of excesses (e.g., The Tech Bubble circa 2000 and the Global Financial Crisis circa 2007-2009), and sometimes they occur due to unforeseen and unpredictable events. The current Coronavirus pandemic is one such unpredictable exogenous shock that has already taken a sharp toll on investor capital. The graph we share today illustrates that while crises can be drastic and painful, the stock market has recovered in each circumstance and it is only the behavior of locking in losses by selling during panic that creates a permanent destruction of capital for investors.
Crises and Long-Term Performance
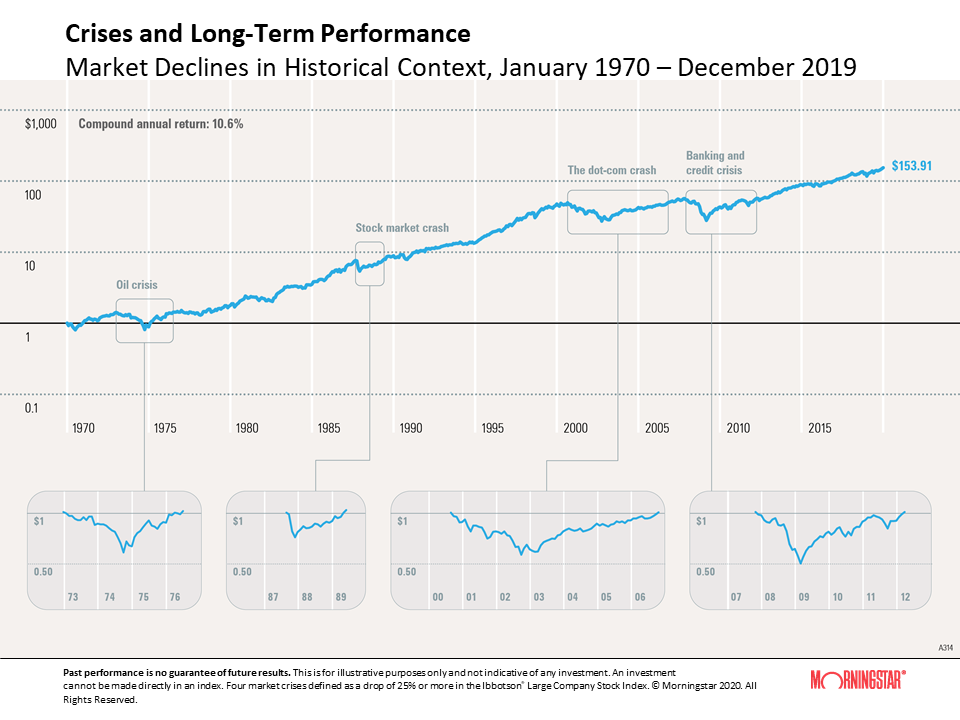
Economies and markets tend to move in cycles, and any stock market can have a downturn once in a while. Most investors lose money when the stock market goes down, but some people may think they can time the market and gain. For example, an investor may aim to buy in when the market is at the very bottom and cash out when the recovery is complete, thus enjoying the entire upside.
The problem with this type of reasoning is that it’s impossible to know when the market hits bottom. Most investors panic when the market starts to decline, then they decide to wait and end up selling after they have already lost considerable value. Or, on the recovery side, they buy in after the initial surge in value has passed and miss most of the upward momentum.The graph illustrates the growth of USD 1 invested in U.S. large stocks at the beginning of 1970 and the four major market declines that subsequently occurred, including the recent banking and credit crisis. Panic is understandable in times of market turmoil, but investors who flee in such moments may come to regret it.
Each crisis, when it happens, feels like the worst one ever (the most recent one, as evidenced by the image, actually was). When viewed in isolation on the lower-tier graphs, each decline appears disastrous. However, historical data suggests that holding on through difficult times can pay off in the long run. For example, USD 1 invested in January 1970 grew to USD $153.91 by December 2019, generating a 10.6% compound annual return. And in the past, when looking at the big picture, every crisis has been eclipsed by long-term growth.
Returns and principal invested in stocks are not guaranteed.
About the data
Stocks are represented by the Ibbotson® Large Company Stock Index. An investment cannot be made directly in an index. Four market crises defined as a drop of 25% or more in the index. Return is represented by the compound annual return.