Bonds have gotten a bad rap lately. It’s understandable. Last year was a terrible year for the bond market, with the Bloomberg U.S. Aggregate Bond Index, the key benchmark for bond returns, posting a painful 13% loss. And while that was certainly not an ideal scenario for bond investors, the hardest pill to swallow was the fact that the decline coincided with a significant drop in the stock market, with the S&P 500 also down double digits at 18%. It left some questioning the role of bonds as ‘the great diversifier’ that is often used to protect balanced portfolios when stocks—or equities—fall.
Though it’s true that bonds didn’t serve investors as well as usual last year, at LCM, we still believe in the power of bonds. Even after a disappointing 2022 for bond investors, now is not the time to throw out the baby with the bathwater! Our goal has always been to grow and protect our clients’ assets. With that in top of mind, here are the key reasons we still believe that including bonds is key to the long-term growth of our balanced portfolios:
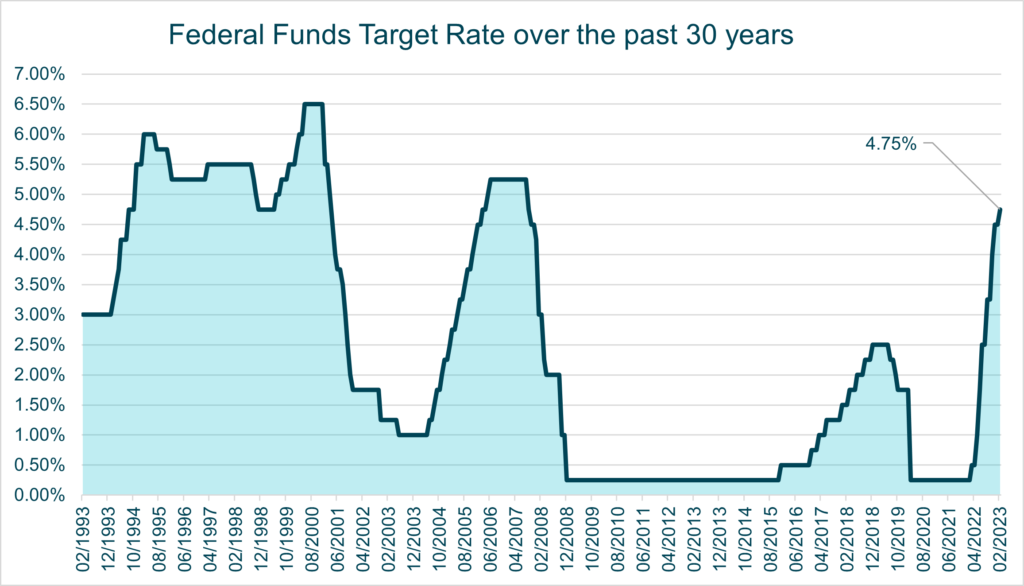
Federal Funds Rate[1]
Though interest rates will inevitably rise and fall over time depending on a variety of economic factors, studies show that the correlation between stocks and bonds tends to remain relatively low (or negative) during ‘normal’ periods of steadily rising and falling interest rates. And conversely, when rising rates are the result of an economic shock, such as unexpected inflation, stock-bond correlations rise. This is exactly what occurred in 2022.
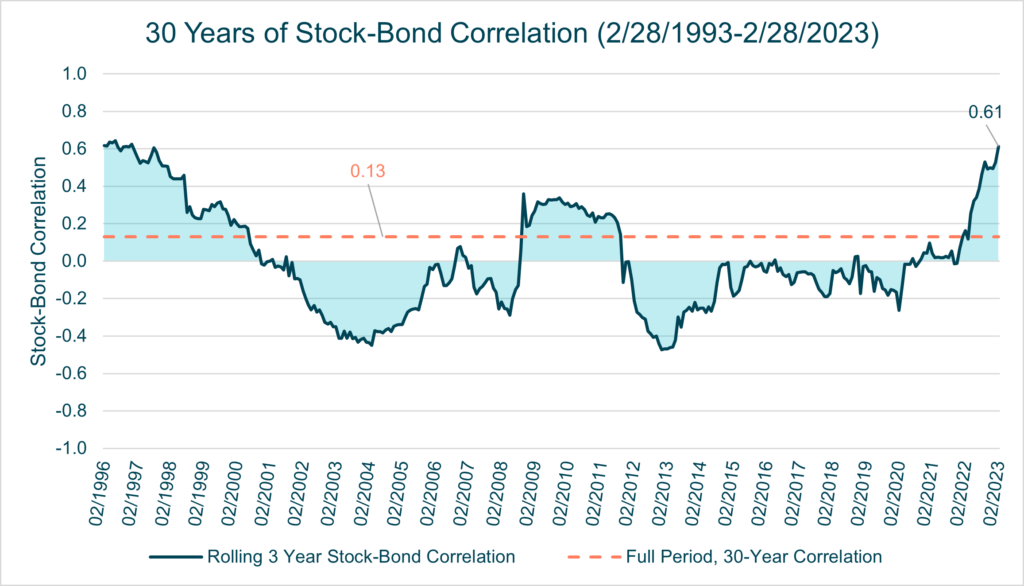
30 Years of Stock-Bond Correlation[2]
As we look ahead to the remainder of 2023 and beyond, it is likely that inflation will continue to decline. Already, both headline and core CPI inflation have trended down from their recent highs, and as the chart below shows, the Fed’s attempts to quash runaway inflation appear to be working. From an investor’s perspective, this tells us that the Fed may finally be ready to ease off on rate hikes and eventually begin to reduce rates gradually over time . When that happens, the combination of lower inflation and (hopefully) lower interest rates should push stocks and bonds toward a more typical correlation.
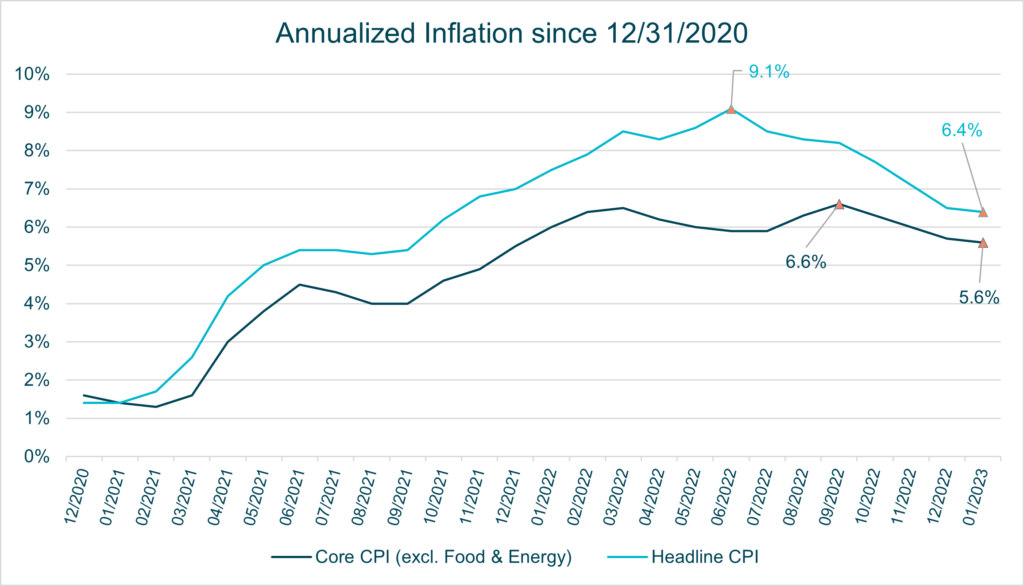
CPI Inflation Since 2020[3]
That is not mere conjecture: data supports this hypothesis. The next figure measures stock-bond correlation at a higher frequency (rolling 50 days). As the graph shows, that correlation spiked at a high of 0.57 in early December 2022, and by February 16, 2023, it had already fallen dramatically to 0.24. But then February provided some strong economic data, with both retail sales data (which is used to measure economic activity) and inflation coming in above expectations. This gave the Fed more cause to keep interest rates elevated. As a result, both stocks and bonds reversed course, increasing correlation once again and putting an end to the rally that kicked off the year. As the markets try desperately to predict the future path of interest rates, and as statistically noisy economic data comes in, investors should prepare for and expect volatility in asset prices.
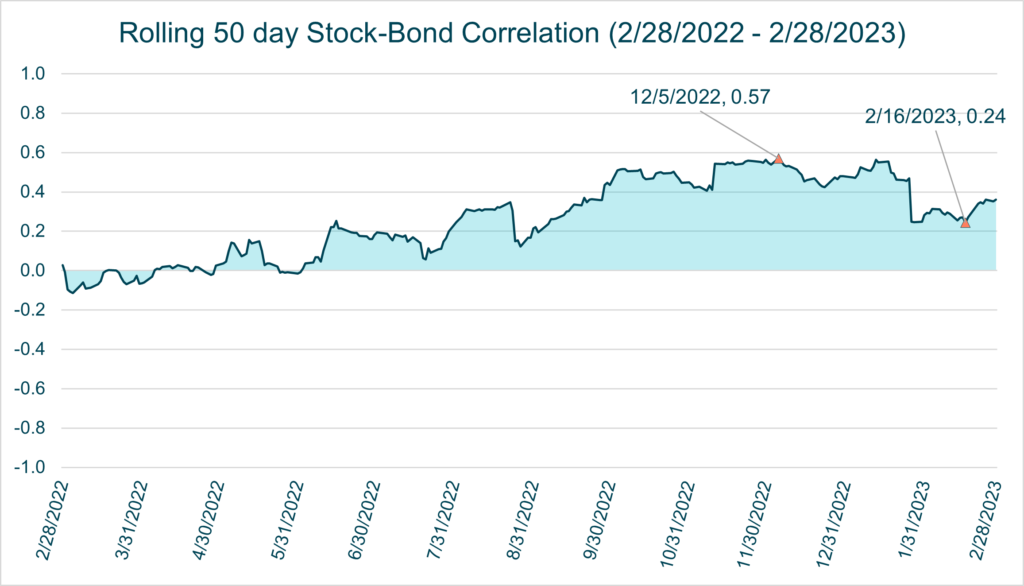
Short-term Stock-Bond Correlation over the past year[4]
Our goal, always, is to help grow and protect your wealth , and each of these factors points to the power of including bonds to reduce the risk within a balanced portfolio. Despite what we saw in 2022, core bonds are inherently lower risk investments than stocks. Even ignoring correlations and the power of diversification, by shifting assets from a higher risk investment (stocks) to a lower risk investment (bonds), the average risk of the portfolio drops. It’s that simple.
Plus, while investors who had bond exposure at the start of 2022 experienced negative returns due to rising interest rates, assets invested in bonds in 2023 are likely to earn a higher yield due to the higher starting point in yields (and lower interest rate risk!). With interest rate risk accounted for, a bond investor could move on to consider credit risk. We have not seen a material increase in credit risk thus far, largely because most companies have been able to refinance to reduce the cost of their debt, making them less likely to default on interest payments or maturity payments.
We believe bonds remain ‘the great diversifier,’ and we will continue to balance—and rebalance—our portfolios to manage your investment risk by maintaining an appropriate weight of each asset class according to your investment strategy. (Read more on the art of rebalancing here.) Life is unpredictable, but in the world of investing, we believe some things, including the diversification power of bonds, will always hold true.
[1] Federal Funds Rate, Source: Bloomberg
[2] Stock-bond correlation is calculated using monthly returns for the S&P 500 Index and the Bloomberg Barclays U.S. Aggregate Bond Index. Rolling 36-month figures are graphed, as well as the correlation for the entire period: 2/29/1996-2/28/2023. Source: Bloomberg
[3] Inflation is represented using the Consumer Price Indices (Core & Headline) produced by the U.S. Bureau of Labor Statistics. Period measured is 12/31/2020-1/31/2023. Source: Bloomberg
[4] Stock-bond correlation is calculated using daily returns for the S&P 500 Index and the Bloomberg Barclays U.S. Aggregate Bond Index. Rolling 50-day figures are graphed, for the entire period: 2/28/2022-2/28/2023. Source: Bloomberg