As the calendar flipped to a new year in 2022, the stage was already set for increased market volatility. Since January 1, measures of year-over-year inflation have been reported at levels higher than we’ve seen in decades, the Federal Reserve indicated its intent to start raising interest rates as early as March, and the pandemic has continued to threaten supply chains and the economy with more variants. That was plenty to push the stock market into turmoil—and then came the Russian invasion of Ukraine, one of the largest attacks in Europe since the Second World War.
It’s true that a picture says a thousand words. Here’s a snapshot of the CBOE Volatility Index (also called ‘the fear index,’ or the VIX for short) on 2/24/22. It wasn’t pretty:
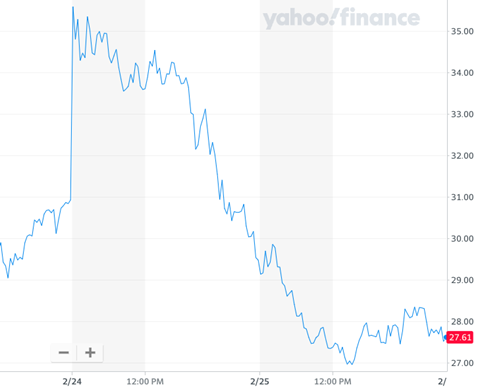
(Source: yahoo! Finance)
It’s never comfortable to watch the market bounce so aggressively. Almost immediately following the events in Ukraine, the Dow dropped in early trading on 2/24/22, only to rebound the next day to see its biggest single-day gains since November 2020. Volatility at that level can leave anyone’s head spinning, but what does it really mean to your portfolio? Here are a few things to keep in mind as the wild ride continues:
(Source: Bloomberg)
It’s been a fantastic run, and it has spoiled us all. That makes it vital to put ‘recency bias’ in check and set realistic expectations. Remind yourself that market fluctuations are normal, that the market historically sees a at least one market correction of 10% decline per year, and that high volatility does not weaken your outcome—it simply requires more patience.
If today’s volatility has you feeling less than comfortable, you’re not alone. The markets have performed like this in the past, but it’s been a while! As a reference, a long-term average of equity market volatility for the period stretching from December 31, 1989, through January 31, 2022, was just under 15%[2]. Contrasted against a shorter and more recent window of time, the 8-year period between the 2008 Financial Crisis and the start of the pandemic, volatility only measured 10.6%[3] thanks, in part, to the Fed’s market-friendly monetary policy. The longer-term and more ‘normal’ measure of volatility averaged a whopping 40% higher than the 8-year ‘easy policy’ period! As we look toward the remainder of 2022 and into 2023, the expectation is that volatility will be higher than the suppressed levels of the recent past. We can look to the long-term average as a starting place to help frame our expectations.
So yes, we’re in for a bumpy ride. As an investor, the most important thing you can do now is stay focused on your long-term plan. If your emotions start to get the best of you, give us a call. Together we can look closely at the details and help ensure your investments are aligned with your financial goals—regardless of whatever market turbulence lies ahead.
[1] For the pre-pandemic period 12/31/2000-2/19/2020, positive daily returns greater than 1% occurred 14% of the time, and negative daily returns lower than -1% occurred 13% of the time.
[2] Using monthly returns, the rolling 10-year average volatility spanning the period 12/31/1989-01/31/2022 was 14.8%
[3] Using monthly returns, the rolling 3-year average volatility spanning the period 2/29/2012-2/29/2020 was 10.6%